| 0 | 1 | 2 | 3 | 4 | 5 | 6 | 7 | 8 | |
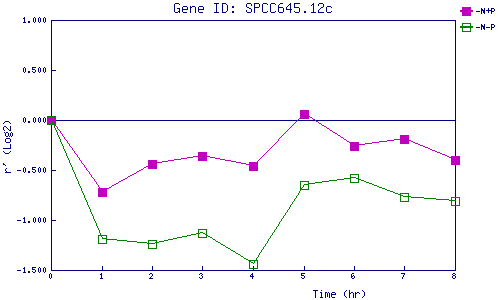
| -N+P | 0.000 | -0.725 | -0.441 | -0.360 | -0.459 | 0.064 | -0.255 | -0.191 | -0.402 |
| -N-P | 0.000 | -1.194 | -1.245 | -1.128 | -1.435 | -0.652 | -0.583 | -0.773 | -0.810 |
|
-N+P: Nitrogen starved in the presence of P-factor -N-P: Nitrogen starved in the absence of P-factor |