sti1
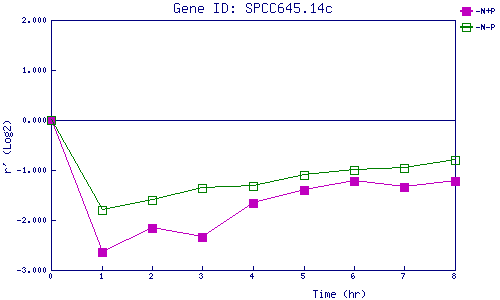
| 0 | 1 | 2 | 3 | 4 | 5 | 6 | 7 | 8 | |
| -N+P | 0.000 | -2.650 | -2.160 | -2.331 | -1.662 | -1.397 | -1.213 | -1.346 | -1.212 |
| -N-P | 0.000 | -1.791 | -1.598 | -1.356 | -1.323 | -1.092 | -1.009 | -0.951 | -0.791 |
|
-N+P: Nitrogen starved in the presence of P-factor -N-P: Nitrogen starved in the absence of P-factor |