rpl39
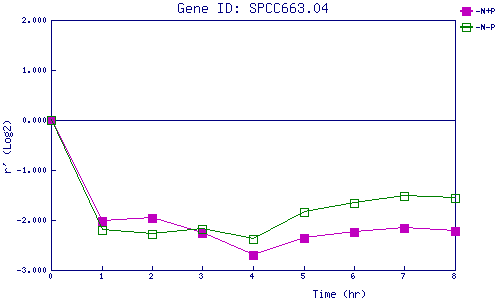
| 0 | 1 | 2 | 3 | 4 | 5 | 6 | 7 | 8 | |
| -N+P | 0.000 | -2.028 | -1.969 | -2.259 | -2.697 | -2.359 | -2.246 | -2.159 | -2.224 |
| -N-P | 0.000 | -2.208 | -2.283 | -2.182 | -2.386 | -1.834 | -1.664 | -1.514 | -1.552 |
|
-N+P: Nitrogen starved in the presence of P-factor -N-P: Nitrogen starved in the absence of P-factor |