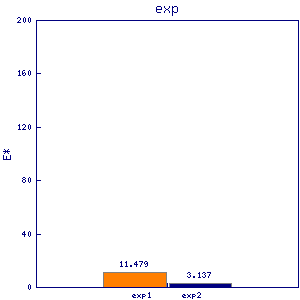
cia1
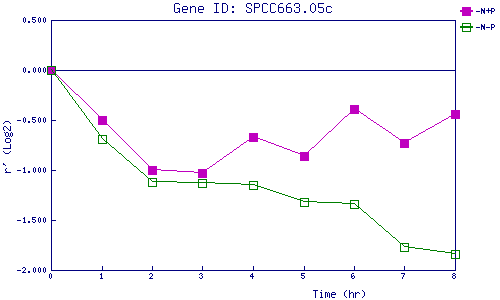
| 0 | 1 | 2 | 3 | 4 | 5 | 6 | 7 | 8 | |
| -N+P | 0.000 | -0.497 | -0.997 | -1.026 | -0.667 | -0.859 | -0.386 | -0.727 | -0.439 |
| -N-P | 0.000 | -0.689 | -1.118 | -1.130 | -1.153 | -1.322 | -1.342 | -1.768 | -1.835 |
|
-N+P: Nitrogen starved in the presence of P-factor -N-P: Nitrogen starved in the absence of P-factor |