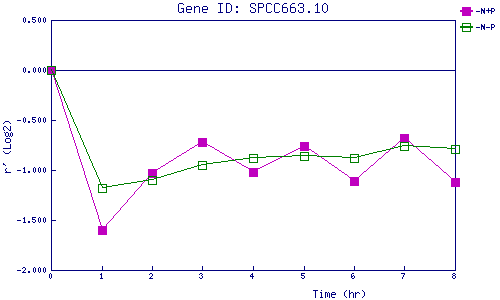
| 0 | 1 | 2 | 3 | 4 | 5 | 6 | 7 | 8 | |
| -N+P | 0.000 | -1.596 | -1.026 | -0.717 | -1.022 | -0.760 | -1.109 | -0.675 | -1.125 |
| -N-P | 0.000 | -1.179 | -1.096 | -0.946 | -0.876 | -0.858 | -0.885 | -0.761 | -0.792 |
|
-N+P: Nitrogen starved in the presence of P-factor -N-P: Nitrogen starved in the absence of P-factor |