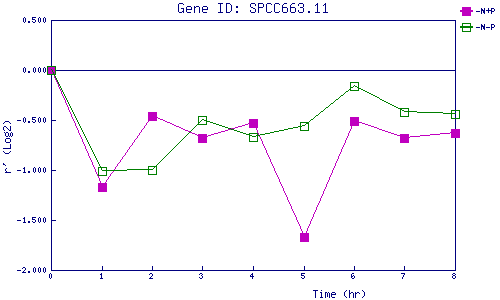
| 0 | 1 | 2 | 3 | 4 | 5 | 6 | 7 | 8 | |
| -N+P | 0.000 | -1.174 | -0.461 | -0.683 | -0.534 | -1.671 | -0.510 | -0.678 | -0.632 |
| -N-P | 0.000 | -1.015 | -0.999 | -0.499 | -0.670 | -0.565 | -0.165 | -0.420 | -0.436 |
|
-N+P: Nitrogen starved in the presence of P-factor -N-P: Nitrogen starved in the absence of P-factor |