cid12
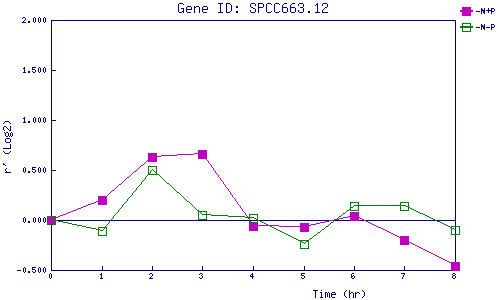
| 0 | 1 | 2 | 3 | 4 | 5 | 6 | 7 | 8 | |
| -N+P | 0.000 | 0.196 | 0.631 | 0.659 | -0.065 | -0.074 | 0.040 | -0.204 | -0.465 |
| -N-P | 0.000 | -0.110 | 0.495 | 0.046 | 0.019 | -0.241 | 0.135 | 0.143 | -0.099 |
|
-N+P: Nitrogen starved in the presence of P-factor -N-P: Nitrogen starved in the absence of P-factor |