| 0 | 1 | 2 | 3 | 4 | 5 | 6 | 7 | 8 | |
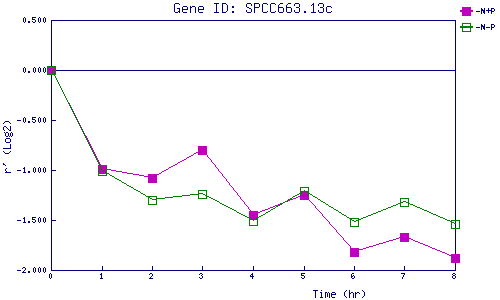
| -N+P | 0.000 | -0.990 | -1.084 | -0.800 | -1.450 | -1.251 | -1.819 | -1.674 | -1.876 |
| -N-P | 0.000 | -1.013 | -1.298 | -1.237 | -1.506 | -1.214 | -1.515 | -1.322 | -1.539 |
|
-N+P: Nitrogen starved in the presence of P-factor -N-P: Nitrogen starved in the absence of P-factor |