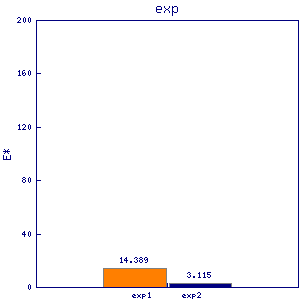
wtf15 wtf7-pseudo
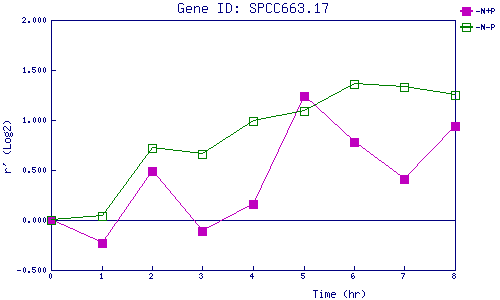
| 0 | 1 | 2 | 3 | 4 | 5 | 6 | 7 | 8 | |
| -N+P | 0.000 | -0.231 | 0.491 | -0.113 | 0.158 | 1.244 | 0.775 | 0.408 | 0.942 |
| -N-P | 0.000 | 0.039 | 0.716 | 0.663 | 0.993 | 1.089 | 1.358 | 1.328 | 1.252 |
|
-N+P: Nitrogen starved in the presence of P-factor -N-P: Nitrogen starved in the absence of P-factor |