| 0 | 1 | 2 | 3 | 4 | 5 | 6 | 7 | 8 | |
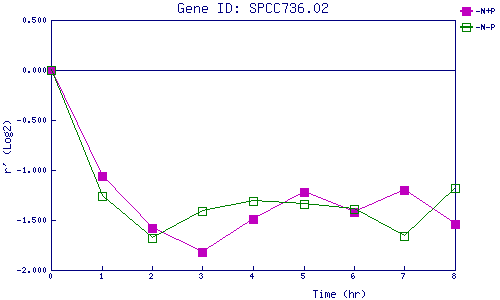
| -N+P | 0.000 | -1.057 | -1.581 | -1.816 | -1.487 | -1.223 | -1.422 | -1.197 | -1.541 |
| -N-P | 0.000 | -1.255 | -1.683 | -1.406 | -1.313 | -1.344 | -1.386 | -1.661 | -1.182 |
|
-N+P: Nitrogen starved in the presence of P-factor -N-P: Nitrogen starved in the absence of P-factor |