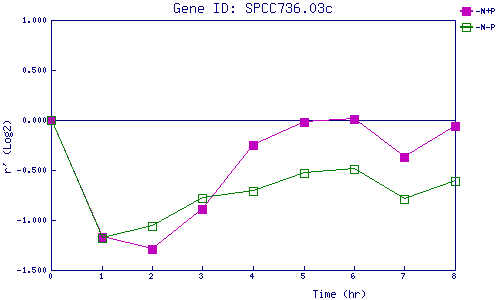
| 0 | 1 | 2 | 3 | 4 | 5 | 6 | 7 | 8 | |
| -N+P | 0.000 | -1.172 | -1.290 | -0.886 | -0.253 | -0.023 | 0.011 | -0.369 | -0.064 |
| -N-P | 0.000 | -1.185 | -1.058 | -0.779 | -0.713 | -0.529 | -0.486 | -0.792 | -0.613 |
|
-N+P: Nitrogen starved in the presence of P-factor -N-P: Nitrogen starved in the absence of P-factor |