wtf7
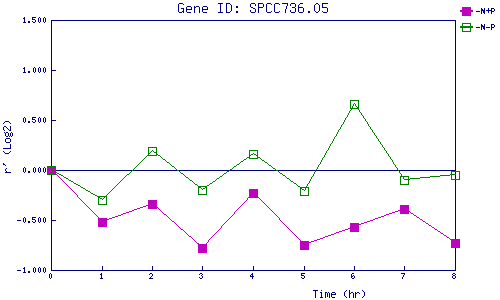
| 0 | 1 | 2 | 3 | 4 | 5 | 6 | 7 | 8 | |
| -N+P | 0.000 | -0.517 | -0.335 | -0.785 | -0.233 | -0.751 | -0.573 | -0.392 | -0.728 |
| -N-P | 0.000 | -0.298 | 0.190 | -0.198 | 0.157 | -0.210 | 0.663 | -0.097 | -0.052 |
|
-N+P: Nitrogen starved in the presence of P-factor -N-P: Nitrogen starved in the absence of P-factor |