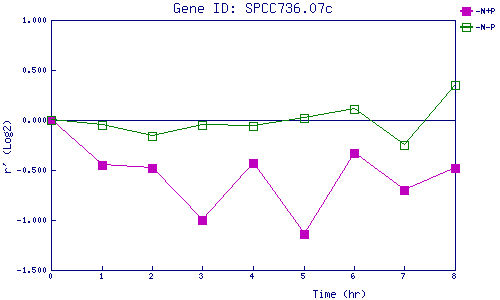
| 0 | 1 | 2 | 3 | 4 | 5 | 6 | 7 | 8 | |
| -N+P | 0.000 | -0.449 | -0.483 | -0.996 | -0.434 | -1.136 | -0.333 | -0.701 | -0.477 |
| -N-P | 0.000 | -0.053 | -0.162 | -0.050 | -0.059 | 0.020 | 0.108 | -0.253 | 0.346 |
|
-N+P: Nitrogen starved in the presence of P-factor -N-P: Nitrogen starved in the absence of P-factor |