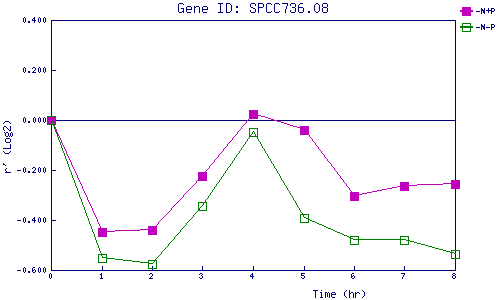
| 0 | 1 | 2 | 3 | 4 | 5 | 6 | 7 | 8 | |
| -N+P | 0.000 | -0.446 | -0.441 | -0.226 | 0.023 | -0.039 | -0.306 | -0.266 | -0.256 |
| -N-P | 0.000 | -0.554 | -0.576 | -0.345 | -0.048 | -0.392 | -0.478 | -0.479 | -0.538 |
|
-N+P: Nitrogen starved in the presence of P-factor -N-P: Nitrogen starved in the absence of P-factor |