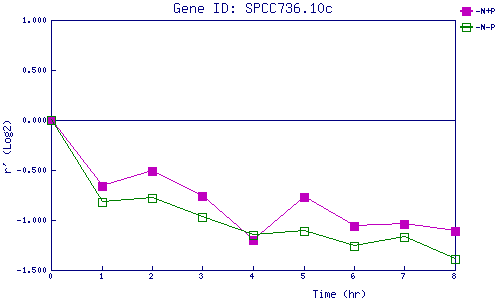
| 0 | 1 | 2 | 3 | 4 | 5 | 6 | 7 | 8 | |
| -N+P | 0.000 | -0.655 | -0.507 | -0.764 | -1.203 | -0.766 | -1.056 | -1.038 | -1.113 |
| -N-P | 0.000 | -0.824 | -0.783 | -0.972 | -1.146 | -1.108 | -1.260 | -1.172 | -1.393 |
|
-N+P: Nitrogen starved in the presence of P-factor -N-P: Nitrogen starved in the absence of P-factor |