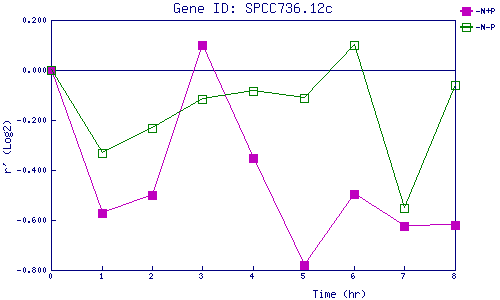
| 0 | 1 | 2 | 3 | 4 | 5 | 6 | 7 | 8 | |
| -N+P | 0.000 | -0.572 | -0.499 | 0.101 | -0.353 | -0.781 | -0.497 | -0.622 | -0.621 |
| -N-P | 0.000 | -0.333 | -0.234 | -0.115 | -0.083 | -0.113 | 0.101 | -0.550 | -0.060 |
|
-N+P: Nitrogen starved in the presence of P-factor -N-P: Nitrogen starved in the absence of P-factor |