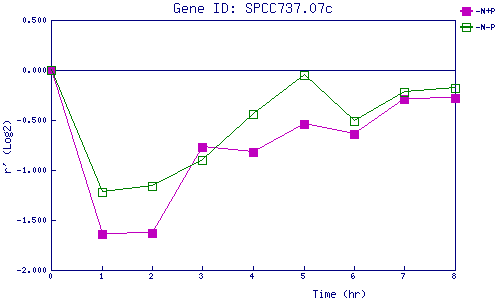
| 0 | 1 | 2 | 3 | 4 | 5 | 6 | 7 | 8 | |
| -N+P | 0.000 | -1.639 | -1.634 | -0.774 | -0.817 | -0.542 | -0.645 | -0.292 | -0.285 |
| -N-P | 0.000 | -1.219 | -1.164 | -0.902 | -0.439 | -0.051 | -0.510 | -0.225 | -0.175 |
|
-N+P: Nitrogen starved in the presence of P-factor -N-P: Nitrogen starved in the absence of P-factor |