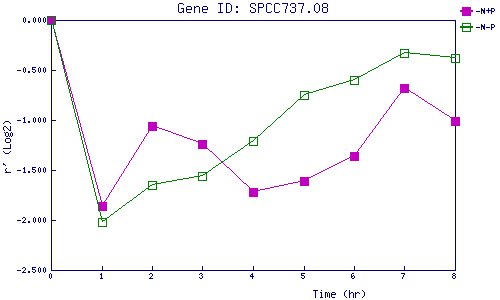
| 0 | 1 | 2 | 3 | 4 | 5 | 6 | 7 | 8 | |
| -N+P | 0.000 | -1.864 | -1.065 | -1.242 | -1.721 | -1.607 | -1.365 | -0.682 | -1.008 |
| -N-P | 0.000 | -2.019 | -1.653 | -1.558 | -1.206 | -0.752 | -0.595 | -0.326 | -0.377 |
|
-N+P: Nitrogen starved in the presence of P-factor -N-P: Nitrogen starved in the absence of P-factor |