sly1
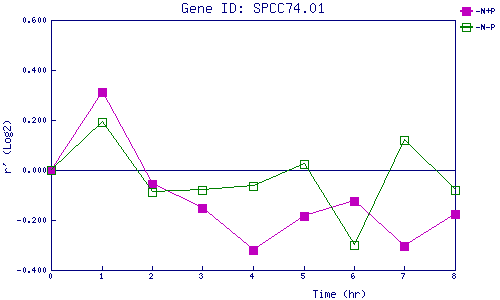
| 0 | 1 | 2 | 3 | 4 | 5 | 6 | 7 | 8 | |
| -N+P | 0.000 | 0.314 | -0.054 | -0.151 | -0.321 | -0.182 | -0.124 | -0.303 | -0.178 |
| -N-P | 0.000 | 0.192 | -0.090 | -0.079 | -0.062 | 0.022 | -0.299 | 0.122 | -0.078 |
|
-N+P: Nitrogen starved in the presence of P-factor -N-P: Nitrogen starved in the absence of P-factor |