nic1
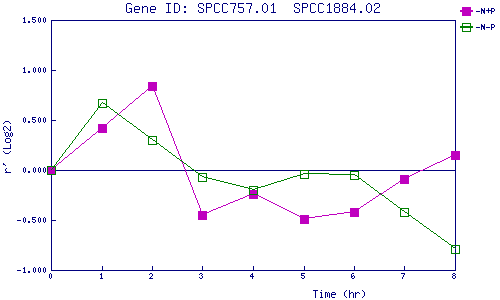
| 0 | 1 | 2 | 3 | 4 | 5 | 6 | 7 | 8 | |
| -N+P | 0.000 | 0.419 | 0.841 | -0.452 | -0.242 | -0.494 | -0.420 | -0.086 | 0.147 |
| -N-P | 0.000 | 0.672 | 0.296 | -0.069 | -0.200 | -0.044 | -0.050 | -0.421 | -0.788 |
|
-N+P: Nitrogen starved in the presence of P-factor -N-P: Nitrogen starved in the absence of P-factor |