| 0 | 1 | 2 | 3 | 4 | 5 | 6 | 7 | 8 | |
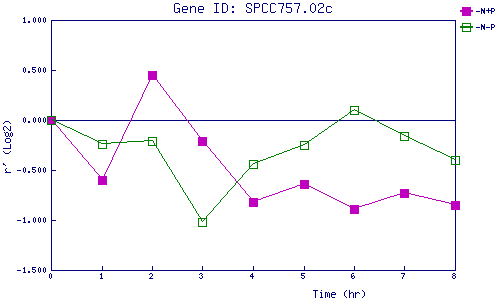
| -N+P | 0.000 | -0.596 | 0.447 | -0.214 | -0.821 | -0.635 | -0.887 | -0.733 | -0.853 |
| -N-P | 0.000 | -0.244 | -0.210 | -1.025 | -0.444 | -0.248 | 0.101 | -0.161 | -0.395 |
|
-N+P: Nitrogen starved in the presence of P-factor -N-P: Nitrogen starved in the absence of P-factor |