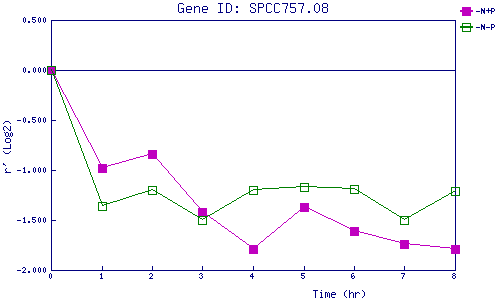
| 0 | 1 | 2 | 3 | 4 | 5 | 6 | 7 | 8 | |
| -N+P | 0.000 | -0.985 | -0.843 | -1.421 | -1.787 | -1.367 | -1.608 | -1.742 | -1.787 |
| -N-P | 0.000 | -1.359 | -1.198 | -1.498 | -1.195 | -1.168 | -1.193 | -1.498 | -1.214 |
|
-N+P: Nitrogen starved in the presence of P-factor -N-P: Nitrogen starved in the absence of P-factor |