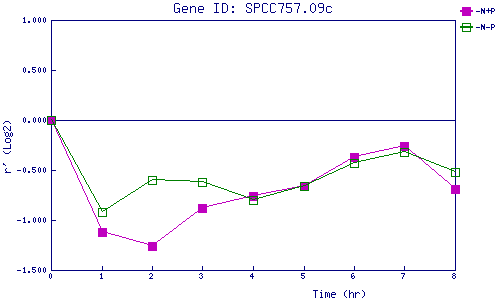
| 0 | 1 | 2 | 3 | 4 | 5 | 6 | 7 | 8 | |
| -N+P | 0.000 | -1.125 | -1.263 | -0.875 | -0.763 | -0.662 | -0.366 | -0.260 | -0.694 |
| -N-P | 0.000 | -0.915 | -0.595 | -0.623 | -0.795 | -0.663 | -0.428 | -0.322 | -0.524 |
|
-N+P: Nitrogen starved in the presence of P-factor -N-P: Nitrogen starved in the absence of P-factor |