| 0 | 1 | 2 | 3 | 4 | 5 | 6 | 7 | 8 | |
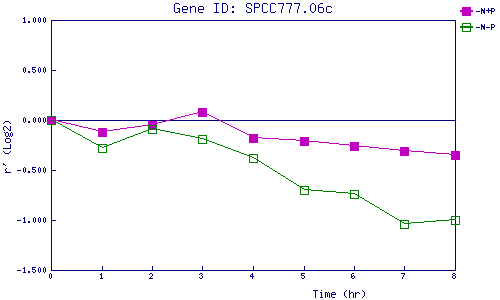
| -N+P | 0.000 | -0.123 | -0.047 | 0.078 | -0.183 | -0.214 | -0.263 | -0.310 | -0.354 |
| -N-P | 0.000 | -0.275 | -0.090 | -0.186 | -0.383 | -0.702 | -0.744 | -1.043 | -1.001 |
|
-N+P: Nitrogen starved in the presence of P-factor -N-P: Nitrogen starved in the absence of P-factor |