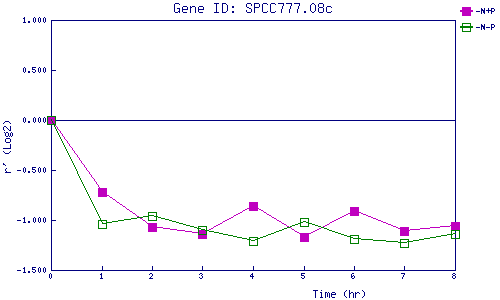
| 0 | 1 | 2 | 3 | 4 | 5 | 6 | 7 | 8 | |
| -N+P | 0.000 | -0.715 | -1.073 | -1.136 | -0.860 | -1.171 | -0.912 | -1.110 | -1.063 |
| -N-P | 0.000 | -1.041 | -0.955 | -1.100 | -1.210 | -1.021 | -1.192 | -1.229 | -1.138 |
|
-N+P: Nitrogen starved in the presence of P-factor -N-P: Nitrogen starved in the absence of P-factor |