arg1
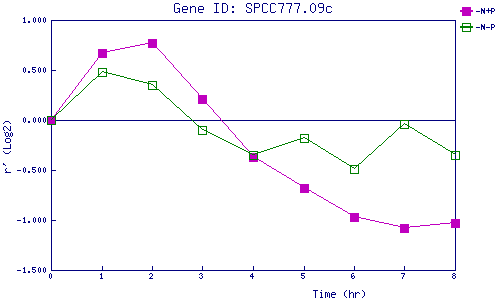
| 0 | 1 | 2 | 3 | 4 | 5 | 6 | 7 | 8 | |
| -N+P | 0.000 | 0.672 | 0.770 | 0.211 | -0.372 | -0.679 | -0.974 | -1.079 | -1.029 |
| -N-P | 0.000 | 0.477 | 0.354 | -0.096 | -0.346 | -0.184 | -0.491 | -0.042 | -0.354 |
|
-N+P: Nitrogen starved in the presence of P-factor -N-P: Nitrogen starved in the absence of P-factor |