ubc12
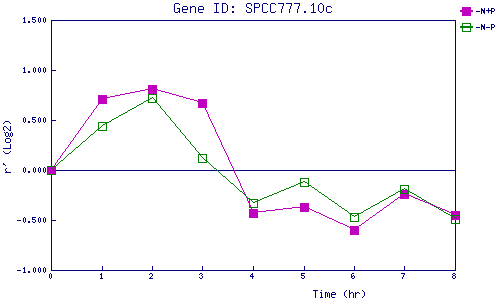
| 0 | 1 | 2 | 3 | 4 | 5 | 6 | 7 | 8 | |
| -N+P | 0.000 | 0.706 | 0.813 | 0.667 | -0.431 | -0.367 | -0.600 | -0.239 | -0.452 |
| -N-P | 0.000 | 0.441 | 0.716 | 0.124 | -0.328 | -0.117 | -0.470 | -0.186 | -0.489 |
|
-N+P: Nitrogen starved in the presence of P-factor -N-P: Nitrogen starved in the absence of P-factor |