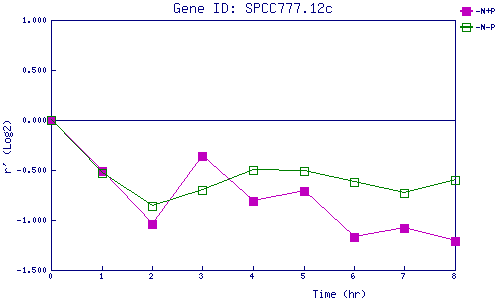
| 0 | 1 | 2 | 3 | 4 | 5 | 6 | 7 | 8 | |
| -N+P | 0.000 | -0.507 | -1.036 | -0.360 | -0.813 | -0.707 | -1.171 | -1.080 | -1.214 |
| -N-P | 0.000 | -0.527 | -0.858 | -0.704 | -0.501 | -0.507 | -0.617 | -0.728 | -0.598 |
|
-N+P: Nitrogen starved in the presence of P-factor -N-P: Nitrogen starved in the absence of P-factor |