prp4
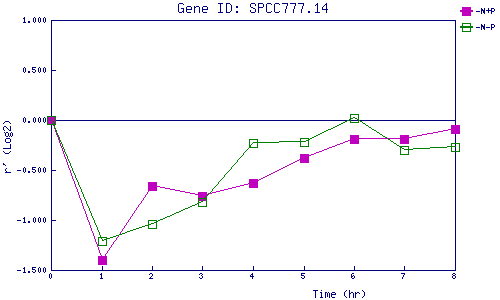
| 0 | 1 | 2 | 3 | 4 | 5 | 6 | 7 | 8 | |
| -N+P | 0.000 | -1.403 | -0.665 | -0.759 | -0.630 | -0.380 | -0.186 | -0.188 | -0.086 |
| -N-P | 0.000 | -1.208 | -1.045 | -0.818 | -0.230 | -0.219 | 0.024 | -0.300 | -0.268 |
|
-N+P: Nitrogen starved in the presence of P-factor -N-P: Nitrogen starved in the absence of P-factor |