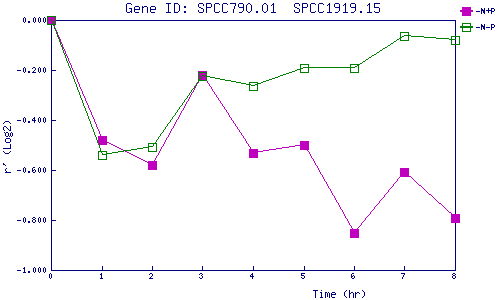
| 0 | 1 | 2 | 3 | 4 | 5 | 6 | 7 | 8 | |
| -N+P | 0.000 | -0.479 | -0.579 | -0.219 | -0.532 | -0.501 | -0.851 | -0.607 | -0.793 |
| -N-P | 0.000 | -0.541 | -0.509 | -0.226 | -0.262 | -0.190 | -0.190 | -0.065 | -0.081 |
|
-N+P: Nitrogen starved in the presence of P-factor -N-P: Nitrogen starved in the absence of P-factor |