| 0 | 1 | 2 | 3 | 4 | 5 | 6 | 7 | 8 | |
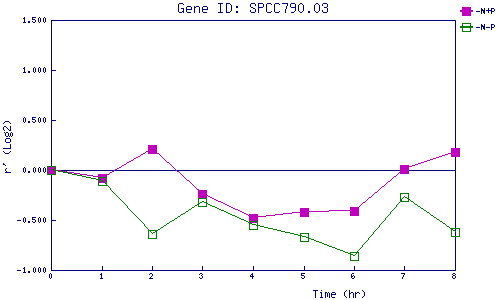
| -N+P | 0.000 | -0.078 | 0.208 | -0.238 | -0.482 | -0.418 | -0.411 | 0.010 | 0.176 |
| -N-P | 0.000 | -0.114 | -0.636 | -0.321 | -0.546 | -0.667 | -0.855 | -0.271 | -0.624 |
|
-N+P: Nitrogen starved in the presence of P-factor -N-P: Nitrogen starved in the absence of P-factor |
