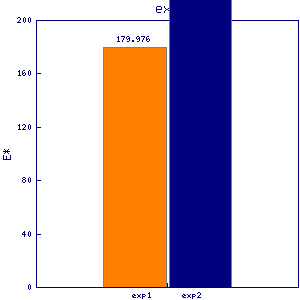
tef1-e ef1a-e ef1a-a
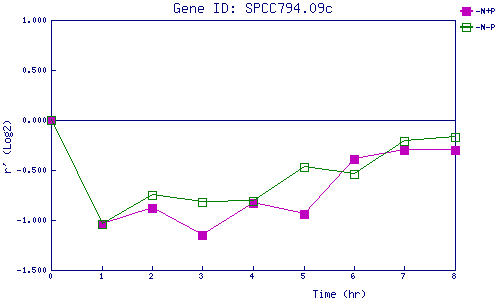
| 0 | 1 | 2 | 3 | 4 | 5 | 6 | 7 | 8 | |
| -N+P | 0.000 | -1.043 | -0.880 | -1.147 | -0.832 | -0.935 | -0.392 | -0.296 | -0.305 |
| -N-P | 0.000 | -1.037 | -0.747 | -0.823 | -0.812 | -0.468 | -0.543 | -0.208 | -0.170 |
|
-N+P: Nitrogen starved in the presence of P-factor -N-P: Nitrogen starved in the absence of P-factor |