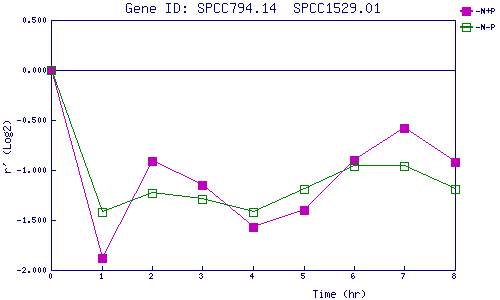
| 0 | 1 | 2 | 3 | 4 | 5 | 6 | 7 | 8 | |
| -N+P | 0.000 | -1.883 | -0.908 | -1.152 | -1.569 | -1.400 | -0.900 | -0.576 | -0.925 |
| -N-P | 0.000 | -1.421 | -1.234 | -1.289 | -1.425 | -1.190 | -0.955 | -0.963 | -1.190 |
|
-N+P: Nitrogen starved in the presence of P-factor -N-P: Nitrogen starved in the absence of P-factor |