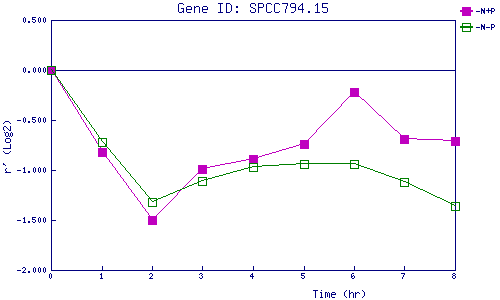
| 0 | 1 | 2 | 3 | 4 | 5 | 6 | 7 | 8 | |
| -N+P | 0.000 | -0.821 | -1.501 | -0.990 | -0.890 | -0.736 | -0.217 | -0.689 | -0.709 |
| -N-P | 0.000 | -0.725 | -1.320 | -1.109 | -0.971 | -0.938 | -0.945 | -1.122 | -1.364 |
|
-N+P: Nitrogen starved in the presence of P-factor -N-P: Nitrogen starved in the absence of P-factor |