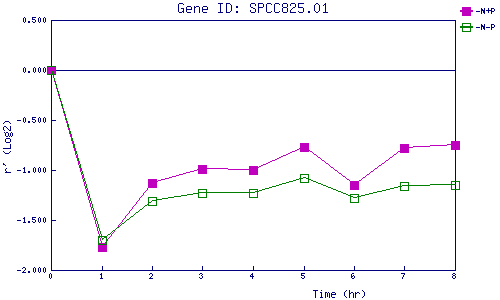
| 0 | 1 | 2 | 3 | 4 | 5 | 6 | 7 | 8 | |
| -N+P | 0.000 | -1.770 | -1.126 | -0.990 | -0.998 | -0.768 | -1.153 | -0.779 | -0.752 |
| -N-P | 0.000 | -1.704 | -1.306 | -1.233 | -1.235 | -1.078 | -1.283 | -1.157 | -1.148 |
|
-N+P: Nitrogen starved in the presence of P-factor -N-P: Nitrogen starved in the absence of P-factor |
