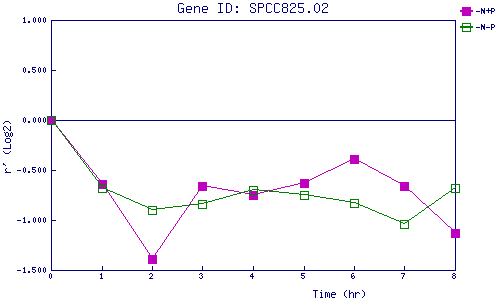
| 0 | 1 | 2 | 3 | 4 | 5 | 6 | 7 | 8 | |
| -N+P | 0.000 | -0.640 | -1.394 | -0.664 | -0.748 | -0.630 | -0.393 | -0.661 | -1.129 |
| -N-P | 0.000 | -0.680 | -0.903 | -0.836 | -0.701 | -0.750 | -0.830 | -1.035 | -0.677 |
|
-N+P: Nitrogen starved in the presence of P-factor -N-P: Nitrogen starved in the absence of P-factor |