psy1 sso1
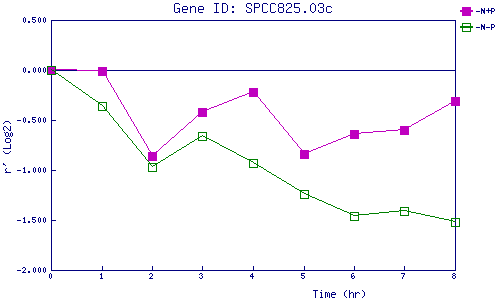
| 0 | 1 | 2 | 3 | 4 | 5 | 6 | 7 | 8 | |
| -N+P | 0.000 | -0.009 | -0.862 | -0.423 | -0.224 | -0.836 | -0.637 | -0.598 | -0.314 |
| -N-P | 0.000 | -0.362 | -0.966 | -0.665 | -0.927 | -1.241 | -1.464 | -1.407 | -1.518 |
|
-N+P: Nitrogen starved in the presence of P-factor -N-P: Nitrogen starved in the absence of P-factor |