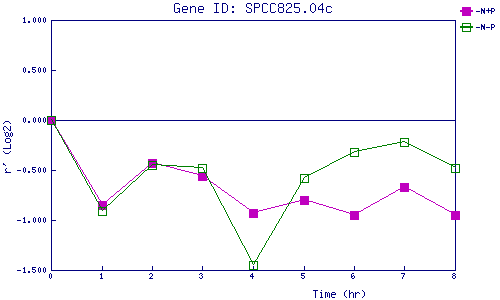
| 0 | 1 | 2 | 3 | 4 | 5 | 6 | 7 | 8 | |
| -N+P | 0.000 | -0.847 | -0.432 | -0.562 | -0.929 | -0.798 | -0.949 | -0.674 | -0.948 |
| -N-P | 0.000 | -0.906 | -0.453 | -0.482 | -1.452 | -0.585 | -0.320 | -0.222 | -0.484 |
|
-N+P: Nitrogen starved in the presence of P-factor -N-P: Nitrogen starved in the absence of P-factor |
