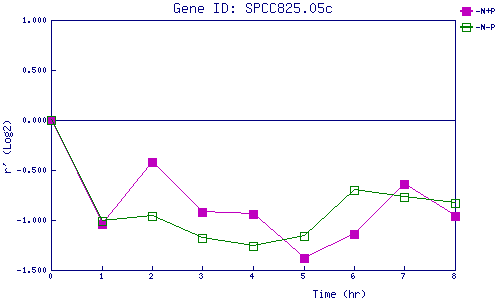
| 0 | 1 | 2 | 3 | 4 | 5 | 6 | 7 | 8 | |
| -N+P | 0.000 | -1.042 | -0.416 | -0.920 | -0.937 | -1.382 | -1.141 | -0.639 | -0.963 |
| -N-P | 0.000 | -1.010 | -0.957 | -1.181 | -1.259 | -1.158 | -0.705 | -0.774 | -0.829 |
|
-N+P: Nitrogen starved in the presence of P-factor -N-P: Nitrogen starved in the absence of P-factor |