wtf24 wtf10-pseudo
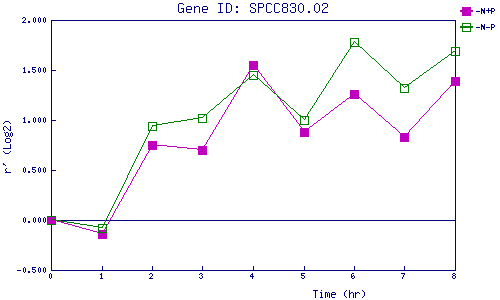
| 0 | 1 | 2 | 3 | 4 | 5 | 6 | 7 | 8 | |
| -N+P | 0.000 | -0.141 | 0.754 | 0.696 | 1.552 | 0.882 | 1.257 | 0.834 | 1.389 |
| -N-P | 0.000 | -0.077 | 0.935 | 1.016 | 1.454 | 1.004 | 1.777 | 1.315 | 1.695 |
|
-N+P: Nitrogen starved in the presence of P-factor -N-P: Nitrogen starved in the absence of P-factor |