| 0 | 1 | 2 | 3 | 4 | 5 | 6 | 7 | 8 | |
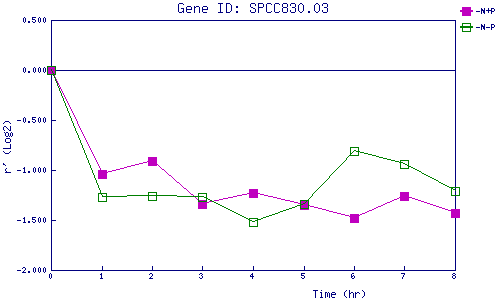
| -N+P | 0.000 | -1.039 | -0.914 | -1.337 | -1.231 | -1.350 | -1.483 | -1.257 | -1.432 |
| -N-P | 0.000 | -1.267 | -1.255 | -1.268 | -1.515 | -1.341 | -0.808 | -0.939 | -1.210 |
|
-N+P: Nitrogen starved in the presence of P-factor -N-P: Nitrogen starved in the absence of P-factor |