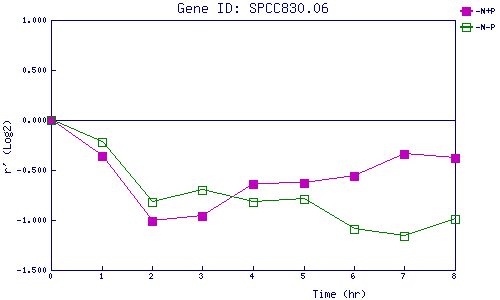
| 0 | 1 | 2 | 3 | 4 | 5 | 6 | 7 | 8 | |
| -N+P | 0.000 | -0.365 | -1.015 | -0.956 | -0.637 | -0.633 | -0.564 | -0.340 | -0.382 |
| -N-P | 0.000 | -0.218 | -0.816 | -0.702 | -0.823 | -0.788 | -1.094 | -1.162 | -0.994 |
|
-N+P: Nitrogen starved in the presence of P-factor -N-P: Nitrogen starved in the absence of P-factor |