psi psi1
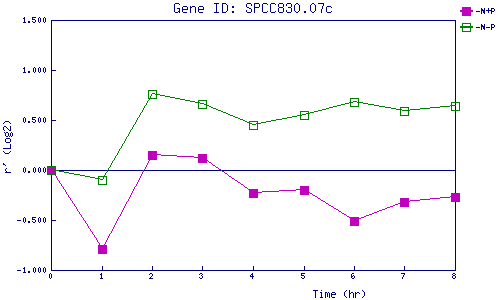
| 0 | 1 | 2 | 3 | 4 | 5 | 6 | 7 | 8 | |
| -N+P | 0.000 | -0.791 | 0.154 | 0.123 | -0.234 | -0.199 | -0.507 | -0.320 | -0.274 |
| -N-P | 0.000 | -0.102 | 0.758 | 0.661 | 0.454 | 0.547 | 0.675 | 0.586 | 0.635 |
|
-N+P: Nitrogen starved in the presence of P-factor -N-P: Nitrogen starved in the absence of P-factor |