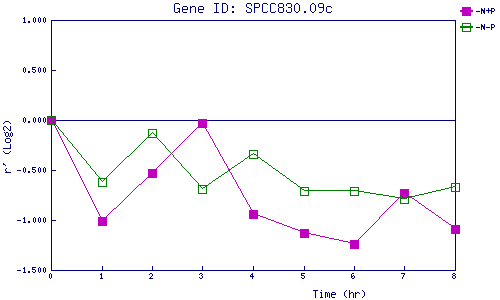
| 0 | 1 | 2 | 3 | 4 | 5 | 6 | 7 | 8 | |
| -N+P | 0.000 | -1.008 | -0.532 | -0.029 | -0.941 | -1.129 | -1.242 | -0.734 | -1.086 |
| -N-P | 0.000 | -0.621 | -0.127 | -0.691 | -0.338 | -0.706 | -0.708 | -0.792 | -0.671 |
|
-N+P: Nitrogen starved in the presence of P-factor -N-P: Nitrogen starved in the absence of P-factor |