| 0 | 1 | 2 | 3 | 4 | 5 | 6 | 7 | 8 | |
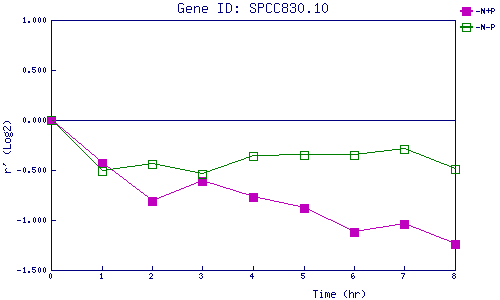
| -N+P | 0.000 | -0.434 | -0.814 | -0.607 | -0.769 | -0.877 | -1.125 | -1.045 | -1.239 |
| -N-P | 0.000 | -0.514 | -0.435 | -0.544 | -0.362 | -0.352 | -0.353 | -0.294 | -0.488 |
|
-N+P: Nitrogen starved in the presence of P-factor -N-P: Nitrogen starved in the absence of P-factor |