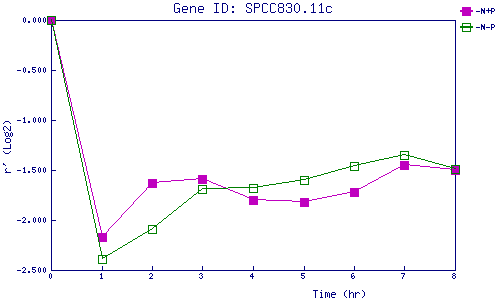
| 0 | 1 | 2 | 3 | 4 | 5 | 6 | 7 | 8 | |
| -N+P | 0.000 | -2.171 | -1.629 | -1.588 | -1.799 | -1.818 | -1.724 | -1.452 | -1.498 |
| -N-P | 0.000 | -2.393 | -2.089 | -1.695 | -1.683 | -1.606 | -1.456 | -1.353 | -1.487 |
|
-N+P: Nitrogen starved in the presence of P-factor -N-P: Nitrogen starved in the absence of P-factor |