| 0 | 1 | 2 | 3 | 4 | 5 | 6 | 7 | 8 | |
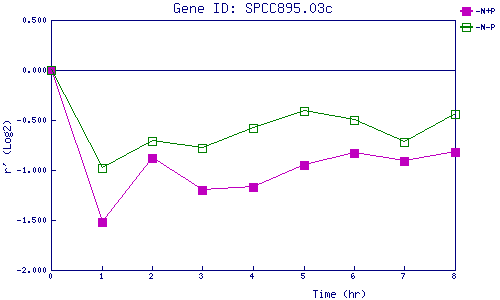
| -N+P | 0.000 | -1.518 | -0.885 | -1.200 | -1.174 | -0.951 | -0.828 | -0.909 | -0.820 |
| -N-P | 0.000 | -0.976 | -0.708 | -0.779 | -0.585 | -0.408 | -0.497 | -0.720 | -0.441 |
|
-N+P: Nitrogen starved in the presence of P-factor -N-P: Nitrogen starved in the absence of P-factor |