for3
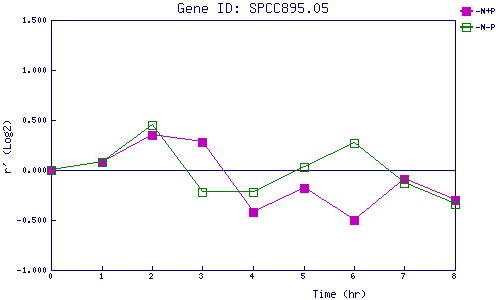
| 0 | 1 | 2 | 3 | 4 | 5 | 6 | 7 | 8 | |
| -N+P | 0.000 | 0.081 | 0.349 | 0.281 | -0.420 | -0.179 | -0.502 | -0.087 | -0.296 |
| -N-P | 0.000 | 0.083 | 0.446 | -0.222 | -0.217 | 0.032 | 0.272 | -0.127 | -0.339 |
|
-N+P: Nitrogen starved in the presence of P-factor -N-P: Nitrogen starved in the absence of P-factor |