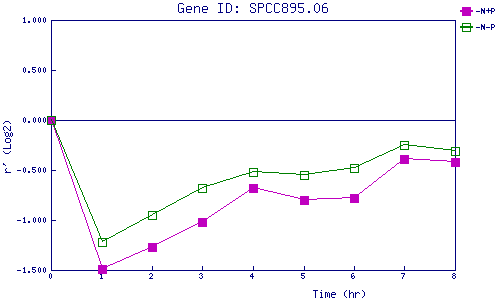
| 0 | 1 | 2 | 3 | 4 | 5 | 6 | 7 | 8 | |
| -N+P | 0.000 | -1.487 | -1.272 | -1.019 | -0.680 | -0.795 | -0.781 | -0.386 | -0.421 |
| -N-P | 0.000 | -1.219 | -0.951 | -0.679 | -0.524 | -0.552 | -0.478 | -0.253 | -0.306 |
|
-N+P: Nitrogen starved in the presence of P-factor -N-P: Nitrogen starved in the absence of P-factor |
