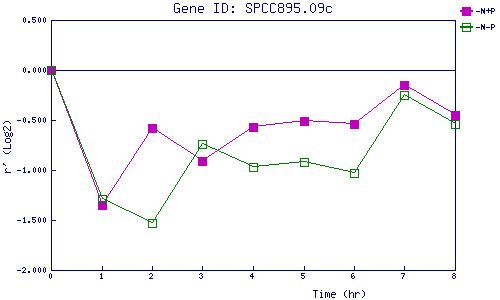
| 0 | 1 | 2 | 3 | 4 | 5 | 6 | 7 | 8 | |
| -N+P | 0.000 | -1.349 | -0.583 | -0.913 | -0.567 | -0.510 | -0.543 | -0.148 | -0.454 |
| -N-P | 0.000 | -1.292 | -1.530 | -0.744 | -0.970 | -0.920 | -1.033 | -0.249 | -0.539 |
|
-N+P: Nitrogen starved in the presence of P-factor -N-P: Nitrogen starved in the absence of P-factor |